My 2015 Select Sector SPDR ETFs Algorithmic Forecast And Allocation
Confira nosso artigo (26/3/2015) no Seeking Alpha: My 2015 Select Sector SPDR ETFs Algorithmic Forecast And Allocation

Clique aqui para ler, comentar, e opinar diretamente no Seeking Alpha.
Acompanhe a performance de nossos artigos.
Summary
- Using Select Sector SPDR’s to minimize company risk & residual risk.
- Using algorithmic allocation to decide where equity should go.
- Calculating the correlation between the various portfolio ETF’s.
- High expected yield; however, still needs further diversification.
In this article I want to talk about the select sector SPDR ETFs; however, you can also use the equivalent sector SPDR’s in the same manner as their correlation is very similar (more info here). There are 9 different sector ETFs which track the S&P500 according to corresponding companies in the sector. The first SPDR ETF was the S&P 500 (NYSE Arca: SPY) that follows the entire index. SPDR is currently the second largest ETF provider only behind iShares, and ahead of Vanguard. All SPDR ETFs are managed by State Street Global Advisors (SSgA), which as of Dec 31, 2013 has over 2.34 trillion of assets under management. SSgA also serves as select sector SPDR’s trust advisor; however, they are managed by State Street Bank and Trust Company and vary in their portfolio allocation.
(click to enlarge)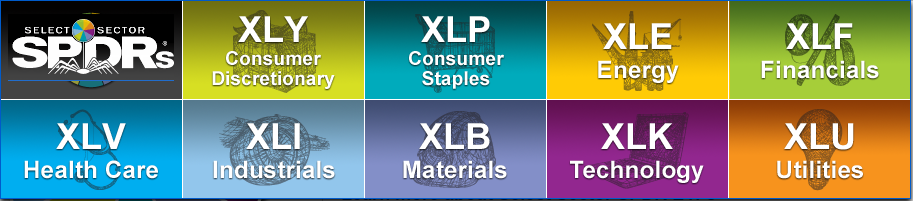
Figure 1: The select sectors SPDR’s.
Because the ETF’s are already diversified within their sectors they manage the company specific risk for the portfolio. This article will focus on the diversifiable risk or residual risk which we can reduce by constructing a portfolio with allocation in different industries. Below we can see the performance of the various ETFs. In the 1 year horizon the best three performers were Health Care (NYSE Arca: XLV/IRY), Consumer Staples (NYSE Arca: XLP/IPS) and Technology (NYSE Arca: XLK/IPK) with returns of 23.37%, 21.21% and 21.12% respectively . The only loser is Energy (NYSE Arca:XLE/IPW), down 7.93% over the last year.
(click to enlarge)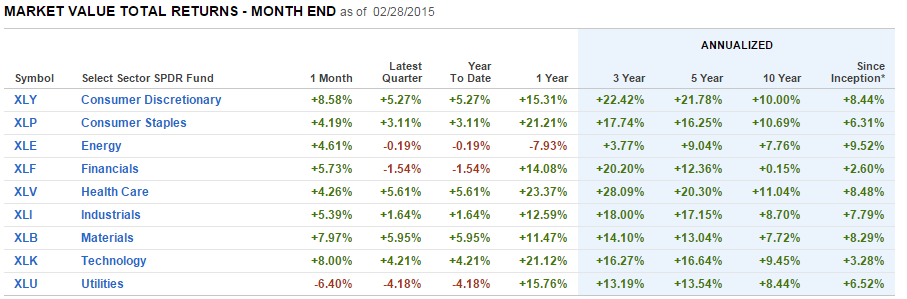
Figure 2: The returns of Select Sector SPDRs.
Signals and Correlation
I first want to present our algorithmic signal output for the 1 year time horizon. The data is taken from I Know First, a financial services firm that utilizes an advanced self-learning algorithm to analyze, model and predict the stock market. The algorithm produces a forecast with a signal and a predictability indicator. The signal is the number in the middle of the box, which is representative of price and direction. The predictability is the number at the bottom of the box. At the top, a specific asset is identified. This format is consistent across all predictions. Our top 4 signals for Select Sector SPDR’s are below.
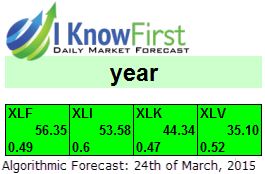
Now let’s understand this data. The first and strongest signal is for XLF(financial). The Signal of 56 is indicative of strength and direction, and should always be viewed in correlation to the other signals. The predictability of 0.49 (rounded 0.5) is a historical accuracy score of the algorithm. -1 represents 100% miss, 0 represents neutral 50% performance and 1 represents 100% performance. Thus we can easily calculate that a 0.5 predictability score equals 75% success rate historically (last 90 days to be more precise).
Next we want to view the assets’ correlations to each other. A higher correlation is worse for the portfolio as it increases the risk which we are trying to diversify. Below is a 3 year correlation table of the various ETFs, all important data is marked in green.
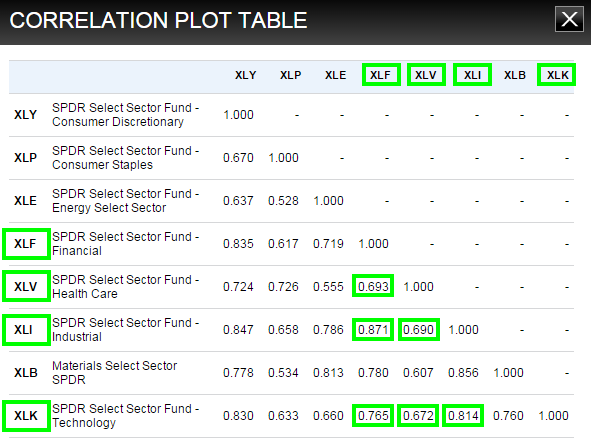
Figure 3: Select Sector SPDR’s correlation table (3 year time horizon)
Here things get a bit complicated, but are still manageable. The reason we still don’t calculate the average correlation is because equity is not allocated evenly (25% to each) and we want to determine the weight of each ETF in the correlation calculation. In order to allocate we will use a previously discussed model of allocating according to the signal strength.
Step 1: Calculating the allocation of equity according to the signal: Here we sum the values and simply divide the signal by the sum.
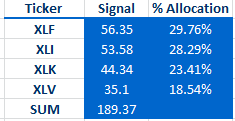
Table 1
Step 2: Determining the correlation effect of each ETF: Here we average all correlations that affect that ETF according to the correlation plot table.
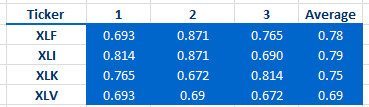
Table 2
Step 3: Combining the correlation and algorithmic equity allocation: Here we simply multiply the percent allocation from table 1 with the average from table 2. The sum of our results is the actual correlation score in the last 3 years in this portfolio.
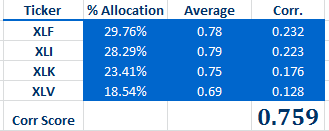
Table 3
Now because the average correlation of all Select Sector SPDR’s in the last 3 years was 0.716, our score of 0.759 is relatively high. I would highly recommend making this a part of your overall portfolio, and not the entire, as it requires further diversification work. A good way to balance out this portfolio, as much of the risk is systematic and undiversifiable (within this universe of sector ETFs), is to make a hedge with gold or currency in order to counter this market wide risk.
In conclusion, this is a great diversified opportunity with a very high expected return. The reason for this is that it is based on the strongest signals with the highest opportunity; furthermore, from the top 4 we again allocate more funds into the stronger signals. The correlation analysis concluded that this particular asset allocation (which we calculated based on the portfolio and presented in table 1) is risky, even though it is in ETFs. The reason for this is that the correlation score of this allocation (0.758) is higher than the average of all scores (0.716), which in itself is also a very high correlation. By definition if the market weakens, all sector ETFs will likely go down together. For this reason, although I would highly recommend this investment, it is not advised to put more than 20-30% of your equity in it. The high correlation, in this scenario, works against the investment as it makes the overall market wide risk very high, but the risk of one company failing is almost nonexistent. If we broke down the investment you are actually dividing your money into 279 different companies with an average of 70 in each sector.
Business Relationship Disclosure: I Know First Research is the analytic branch of I Know First, a financial startup company that specializes in quantitatively predicting the stock market. This article was written by Daniel Hai. We did not receive compensation for this article, and we have no business relationship with any company whose stock is mentioned in this article.