BlackBerry Is A Risky Fruit: Making 232% In A Year Using Fundamental And Algorithmic Trading
Confira nosso último artigo (12/11/2014 )no Seeking Alpha: BlackBerry Is A Risky Fruit: Making 232% In A Year Using Fundamental And Algorithmic Trading

Clique aqui para ler, comentar, e opinar diretamente no Seeking Alpha.
Acompanhe a performance de nossos artigos.
Summary
- BlackBerry stock price is inconsistent with earnings and growth, making BBRY a hard stock to maneuver.
- Optimal trading over the last 12 months would have yielded a staggering 232% return.
- Algorithmic forecast supporting a fundamental breakdown of the stock’s price fluctuations.
The BlackBerry Market
BlackBerry Limited (NASDAQ:BBRY) was a world leader in smartphones, and then it vanished. The company’s US user base, once 21 million, dropped to just 9 million in 2013; this fall was so dramatic that in 2014, it had CNN flagging BlackBerry as one of the US’ six most endangered brands. Recently, BBRY took action to resolve this issue. The company signed a licensing deal with Amazon (NASDAQ:AMZN) in June 2014; which, if properly implemented, will boost BlackBerry app count from a paltry 130,000, to somewhere in the region of 300,000. However, analysts choose to remain on the sidelines while these big changes are happening.
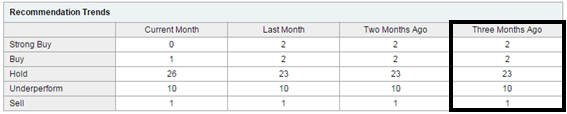
Figure 1: Yahoo Forecast (November 11th, 2014)
Analysts published at Yahoo Finance are not getting too creative. Rather than taking a position, they agree to say nothing. Disappointing, considering BBRY is a stock with 600% growth potential – 10 suggested the stock will underperform.
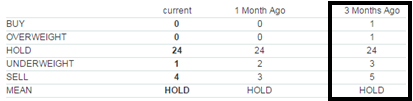
Figure 2: MarketWatch Forecast (November 11th, 2014)
Analysts at MarketWatch avoid giving a position as well, 5 had the courage to take a position – they suggested selling; however, the stock price went up following that prediction.
Why BlackBerry Has Growth Potential
Three months ago (Aug. 20, 2014) in an article for Seeking Alpha “BlackBerry Limited: Before You Buy Or Sell, Hold The Phone! An Algorithmic Perspective“, we explained the subscriber growth anticipated and the overseas growth of BlackBerry. So why would analysts continue to not recommend a stock with incredible growth potential? Hard to say. Possibly fear of going down with a sinking ship or maybe just risk avoidance. In the article mentioned above we released a table of sales and revenues, the surprising figures are under years 2009 and 2013.
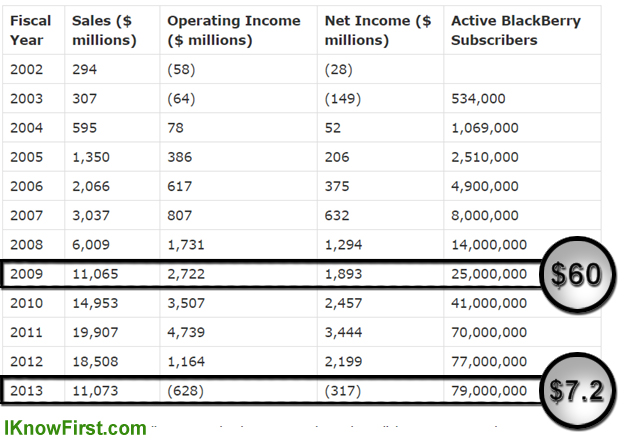
Figure 3: BlackBerry Sales & Net Income Analysis
At the end of 2009, BlackBerry was valued at $60 a share, with revenues of 11 billion. In 2013 the stock price declined to $7.2 a share, with revenues of 11 billion. In 2007, after earning only 3 Billion, the company had a staggering share price of $230. The stock price is inconsistent with earnings and growth, making BBRY a hard stock to maneuver. One of the only ways to profit from such a stock is turning a blind eye to revenues, costs, and implied growth, which is just what the I Know First Algorithm does.
Optimizing Gains Through BlackBerry’s Price Fluctuations
After releasing a bullish signal for BBRY in our SA article we tested our performance in the 3 months “Best Tech Stock” forecast review. Since then the stock went up by almost 14%. We also forecast the 11th of November 55% growth until the 22nd of January in an Upstart Business Journal Article “18 years in the making, stockmarket soothesayer forecasts the future“, which anticipated the short term growth, and decline after. However the stock offers much more potential, and has been for a long time. BlackBerry seems to be a poisonous fruit; however, those who know how to handle it may find it very tasty indeed.
(click to enlarge)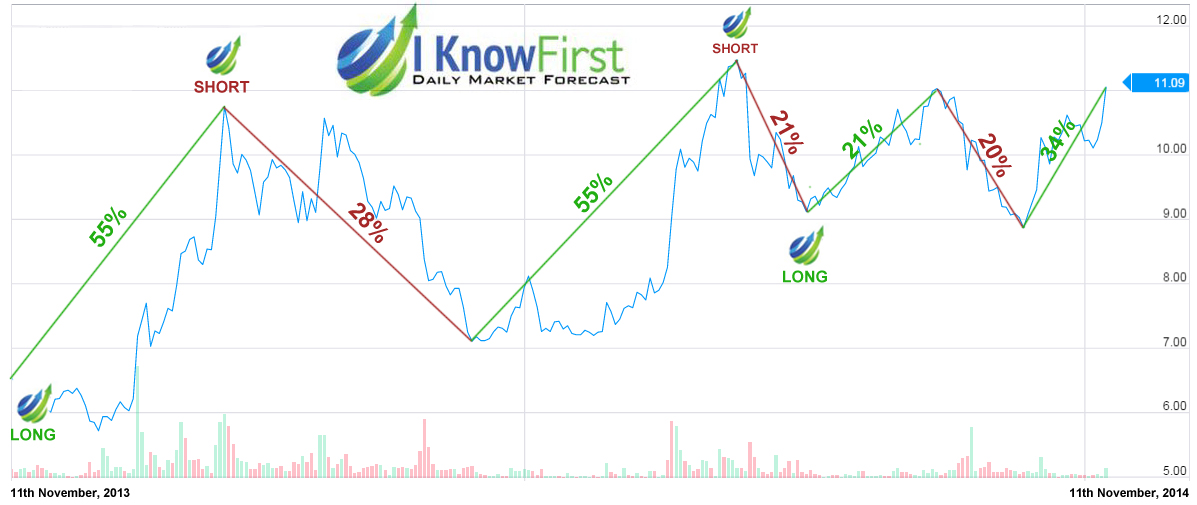
Figure 4: One Year BBRY Stock Analysis.
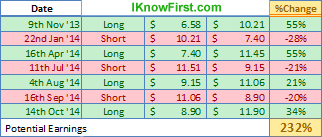
Figure 5: Optimal Trading Analysis (According To Figure 4)
As three months have passed from our last prediction, we want to update the algorithmic forecast. Unlike analysts we refrain from giving no position, and as the table above suggests, our recommendation for BlackBerry right now is to sell/short. While revenue streams begin to have a positive outlook, the market decides the price, and as previous trend has demonstrated people like to bite into the berry, and then throw it away – regardless of actual company performance.
Algorithmic Analysis: Explanation
I Know First is a financial services firm that utilizes an advanced self-learning algorithm to analyze, model and predict the stock market. The algorithm produces a forecast with a signal and a predictability indicator. The signal is the number in the middle of the box. The predictability is the number at the bottom of the box. At the top, a specific asset is identified. This format is consistent across all predictions.
(click to enlarge)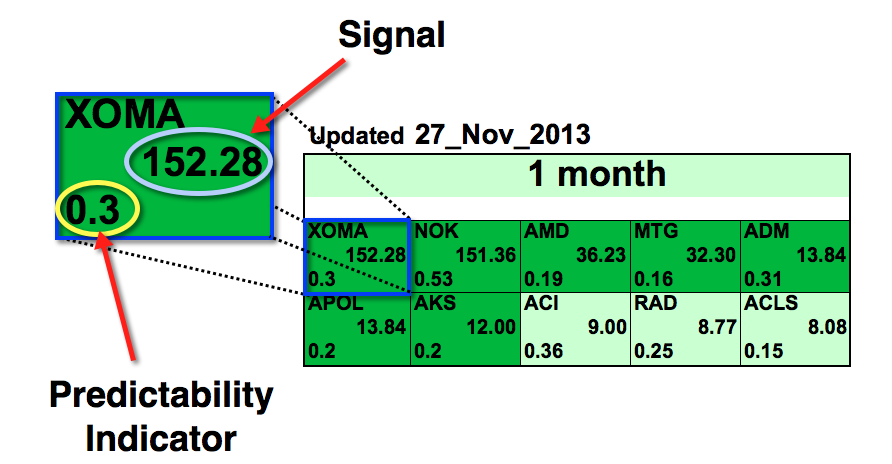
Figure 6: Example of an I Know First Algorithmic Heat Map.
In this particular Top 10 Stocks Forecast from November 27th 2013, XOMA had the strongest 1-month signal but did not have the strongest predictability. As the asset is in a deeper green color box, this indicates that the algorithm is very bullish.
Signal
This indicator represents the predicted movement direction/trend; not a percentage or specific target price. The signal strength indicates how much the current price deviates from what the system considers an equilibrium or “fair” price. The signal strength is the absolute value of the current prediction of the system. The signal can have a positive (predicted increase), or negative (predicted decline) sign. The heat map is arranged according to the signal strength with strongest up signals at the top, while down signals are at the bottom. The table colors are indicative of the signal. Green corresponds to the positive signal and red indicates a negative signal. A deeper color means a stronger signal and a lighter color equals a weaker signal.
Analogy with a spring: The signal strength is how much the spring is stretched. The higher is the tension the more it’ll move when the spring is released.
Predictability
This measures the importance of the signal. The predictability is the historical correlation between the prediction and the actual market movement for that particular asset, which is recalculated daily. Theoretically the predictability ranges from minus one to plus one. The higher this number is the more predictable the particular asset is. If you compare predictability for different time ranges, you’ll find that the longer time ranges have higher predictability. This means that longer-range signals are more important and tend to be more accurate.
Algorithmic Analysis: Forecast
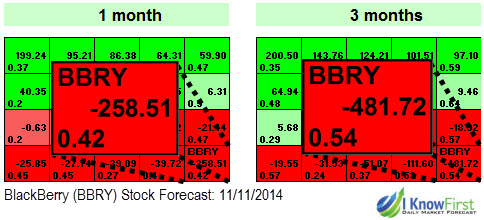
Figure 7: I Know First 1 month, 3 months and 1 year prediction tables for BlackBerry from November 11th, 2014.
The current algorithmic forecast (11/11/2014) has a very strong bearish signal. The 1 month and 3 months’ time horizons have a signal of -258.52 and -481.72, with a very high predictability of 0.42 and 0.54 respectively. Figure 4 suggests a possible stock depreciation of between 10-20% (seems the fluctuations are decreasing); it is likely this drop will be very sharp following the strong 1 months bearish signal. The table above could drastically change, while the 3 months outlook right now sees the stock price go down, the 3 months forecast in 2 weeks could suggest otherwise. For optimal shortingstrategy we recommend executing your trade only when two rules hold true. The first is that the last close is lower than the 5 days average. The second is if the average of the last 5 days forecasts is “down”. If both hold true then sell short.
Conclusion
BlackBerry has had positive signs. Figure 4 suggests an average increasing price, and reduction in price fluctuation. Customer growth and overseas sales signal towards a potential rebound for the company. The history of BlackBerry suggests the price of the stock to be very speculative, and as such, hard to predict. While analysts avoided taking a buy/sell position 3 months ago, I Know First algorithm successfully predicted the price appreciation. Now at the crossroads again, analysts still choose to avoid a solid position (there appears to be a leaning towards selling). The algorithm suggests a strong bearish signal, and advises investors to short the stock.
I Know First Research is the analytic branch of I Know First, a financial startup company that specializes in quantitatively predicting the stock market. This article was written by Daniel Hai, one of our interns. We did not receive compensation for this article, and we have no business relationship with any company whose stock is mentioned in this article.