Google Can Grow Forever, But Is It The Best Investment Right Now?
Confira nosso último artigo (13/11/2014 )no Seeking Alpha: Google Can Grow Forever, But Is It The Best Investment Right Now?
Clique aqui para ler, comentar, e opinar diretamente no Seeking Alpha.
Acompanhe a performance de nossos artigos.
Summary
- Google ranks 13th in growth since its IPO with an annual compounding rate of 28.98%.
- Many projects are down the pipeline insuring the company is able to continue growing.
- The stock has acted in a dividend behavior like growth, signaling towards steady continued growth.
- State of the art algorithm forecast is bullish on Google.
Google’s 10 Years of Growth anniversary
A public company is not valued by its assets; it is valued by what people think its assets are worth. Ten years ago, Google Inc. (NASDAQ:GOOG) (NASDAQ:GOOGL) went public in a much anticipated IPO. A decade later, it has a lot to celebrate. Since Google’s IPO the company was racing up the ladder compounding at an average annual rate of 28.98%; however, they did not race alone. Keurig Green Mountain Inc. (NASDAQ:GMCR) leads the caravan with a whopping 59.17% annualized return, closely followed by Monster Beverage Corp. (NASDAQ:MNST) and Priceline Group Inc. (NASDAQ:PCLN) with average yearly growth rates of 55.29% and 49.19% respectively. In fact, Google was not even a top 10 growth company, it placed 13th. I Know First algorithm bullish signal on Google indicates towards a growth rate surpassing these companies from now until the new year mark.
(click to enlarge)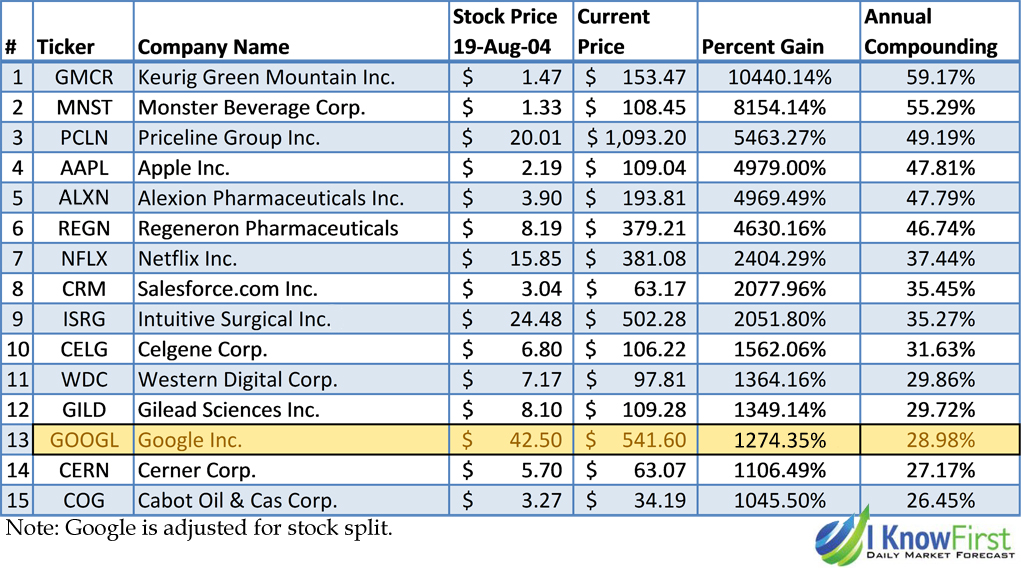
Figure 1: Top performing stocks since Google’s IPO.
Why Google will continue growing.
Google is constantly researching into finding new solutions and innovations. Google began by expanding its internet service from search indexing to E-mail, Finance, Maps, Books, Scholar, etc. However, after understanding that in order to grow farther they must expand, Google X was born. The team is dedicated to making major technological advancements. Some noteworthy projects currently in development are Google Glass, Contact lens (Healthcare), Project Loon, Makani Power, Lift labs, Calico, and others which are not yet revealed. However, two projects stand out to have very a large growth potential in the upcoming years.
Tesla Motors (NASDAQ: TSLA) is bringing electric cars in; and Google wants to take the driver out. The Google Self-Driving Car is a project that involves developing technology for autonomous cars, mainly electric cars. The software powering Google’s cars is called Google Chauffeur, working in parallel to a project being developed at Tesla Motor known as the Autonomous driving project. The technology could include a lot of server based calculation made off the car in real time, for which Google already has a huge competitive advantage.
Of Course Google Must Have a Drone-Delivery Program. Project Wing is an ambitious stride following the self-driving car. With many disaster relief and commercial applications an electric drone aerial system could change the way we deliver. According to Google the drones will “take a big chunk out of the remaining friction of moving things around the world”.
Stocks appreciate with growth, and the android market has a lot of room for growth. While Google hold an 84.7% mobile OS market share, effectively they only own what could be seen as a “you owe me, if I need it”. To farther explain, if Google announced they will charge a mere 10$/android phone instead of offering it for free (at this time it is open source), and continues selling 255 million android units a quarter, it would boost revenues by 2.5 Billion USD. In terms of Q2 revenues (15.9 B) that would be a 16% increase in revenues. In summary, Android is a get out of jail card Google can use if growth stagnates anytime soon.
(click to enlarge)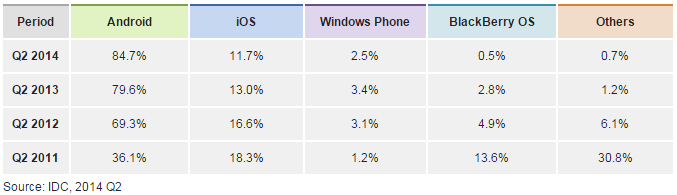
Figure 2: Quarterly data for mobile operating system market share. Source:IDC
Why Google is like a dividend stock.
In a previous article “Coca Cola (NYSE:KO) – Undervalued: Stock Valuation Using A 10-Year Cash Flow Projection and Algorithmic Analysis” we discussed the properties of a solid dividend stock. The effect of the dividend is a reduction in speculation of the stock price, as it is much clearer what returns it will offer (in most cases). When stocks pay no dividend, they become more speculative, allowing for the growths in figure 1. What all the top 10 growth stocks have in common is long periods of low to zero growth, with sudden spurts and dips, followed by a huge increase in stock price. The table below illustrates how these stocks have performed since their respective IPOs.
(click to enlarge)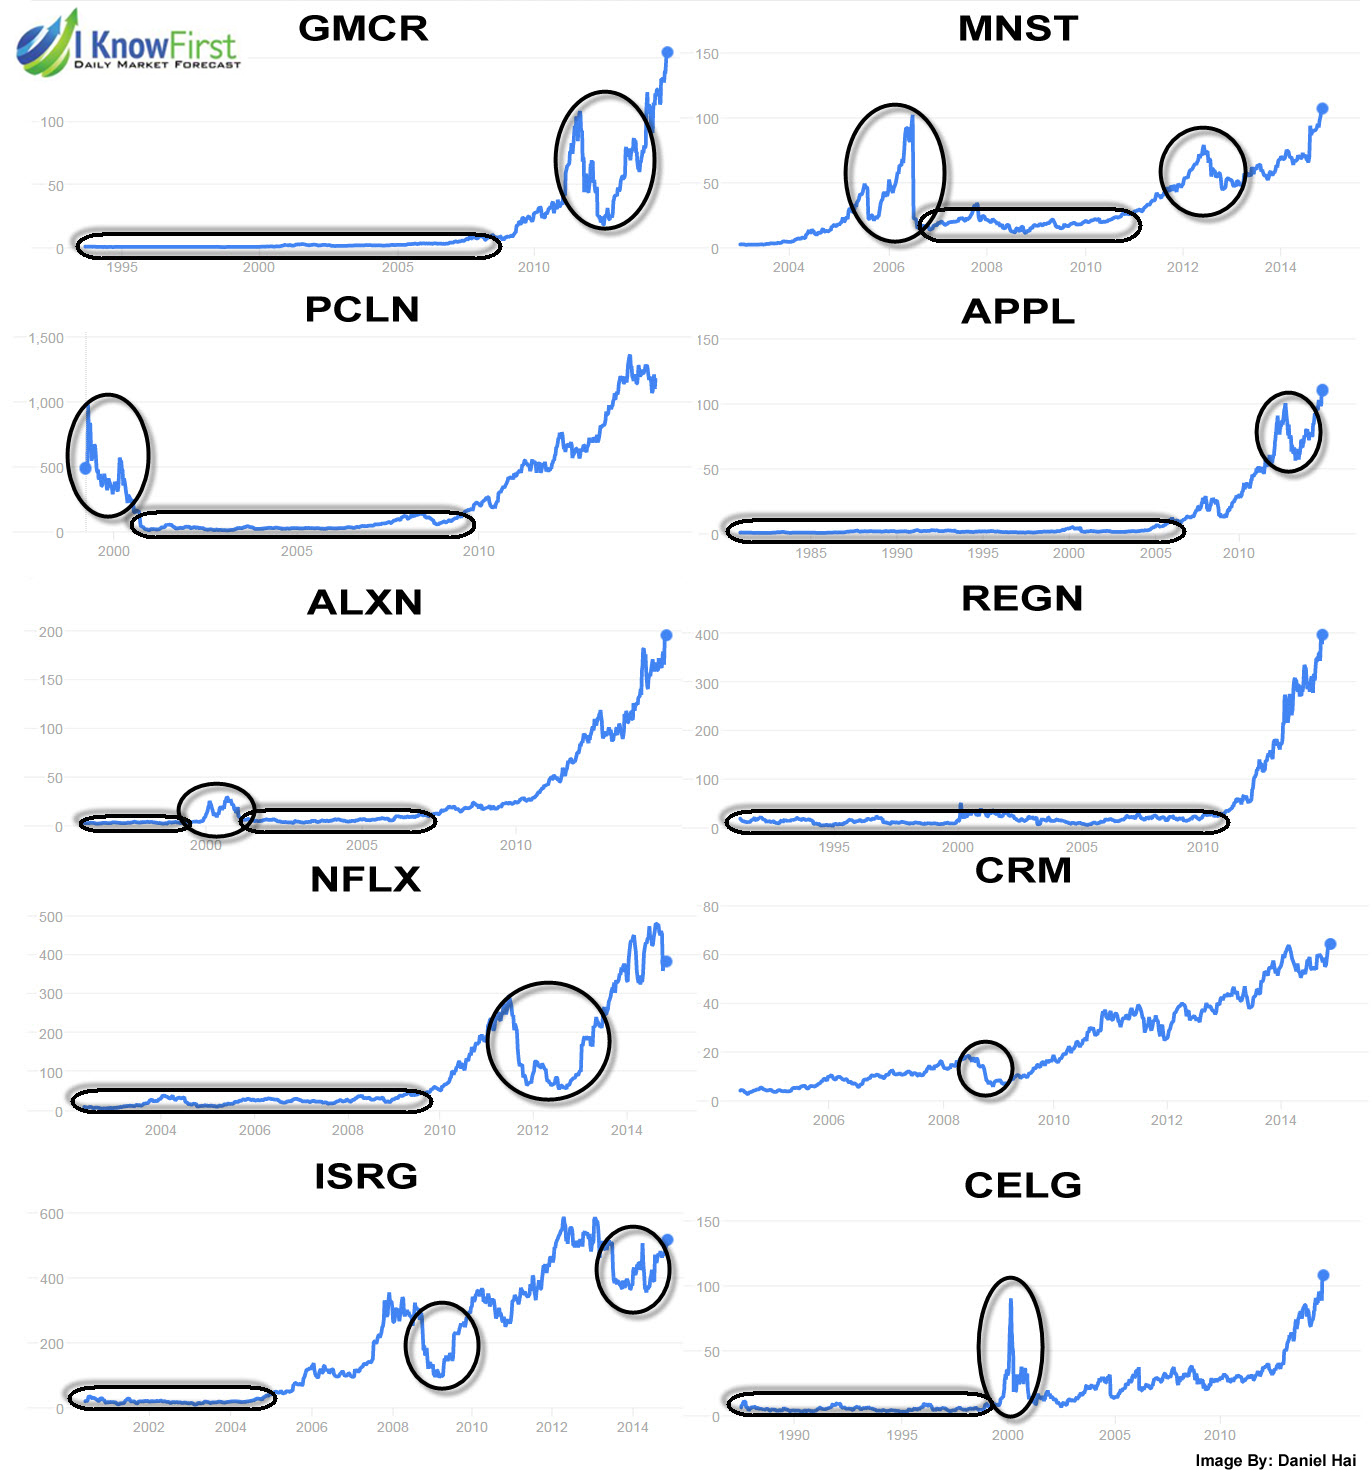
Figure 3: Top 10 performing stocks movement analysis by I Know First. Chart Source: Google
Some experienced a price jump during the Dot-com bubble, and many have had price jumps and falls since (demonstrated by the circles). These stocks have had a large growth spurts, but are inconsistent, which makes them incredibly speculative. Tech stocks such as Priceline, Apple (NASDAQ:AAPL), Netflix (NASDAQ:NFLX) and Salesforce (NYSE:CRM) have a tendency to go as fast as they came. The best example perhaps is BlackBerry (NASDAQ: BBRY) which was valued at 230$ a share in 2007, and looked like the future of technology, and after losing half of their sales volume was revalued at >10$ in 2014. Pharmaceutical companies such as Alexion (NASDAQ:ALXN), Regeneron (NASDAQ:REGN), Intuitive Surgical (NASDAQ:ISRG) and Celgene (NASDAQ:CELG) tend to be extremely overvalued when new health solutions test positive far in the testing pipeline (Around Stage 3 testing); however, pharmaceutical patents expire and medical improvements can devalue them very quickly. Perhaps, the least speculative of the above stocks are Keurig and Monster. Their global appeal and Coca Cola’s endorsement offers a potentially stable future growth. However, if Coca Cola dumps their shares there could be massive fallout, putting the two potentially at risk. Salesforce with the exception of a small dip has proven to be a solid growth stock, although it competes in the cloud computing industry which is very volatile right now, with many large corporations competing for market leadership.
What makes Google so different than these companies is its core. The Google search engine has dominated its market since its creation. For 10 years now over 50% of search inquiries are typed into Google. This service is the true definition of a cash cow. Searching the internet has become a solution for almost any problem, ensuring Google’s dominance for the next century. Even if a startup was able to create a more effective search algorithm than Google’s (and catch up with the years of data aggregating), it would be bought up before it could gain any momentum. Its two competitors are on the rocks as well. Yahoo Search is having a very hard time retaining its customers, and Bing is simply the default search for Explorer, which is bundled with Windows (87% of Bing users come from Internet Explorer). However, in a world going mobile (where android has <80% market share) Windows becomes less of a factor, ensuring Google’s growth. The model of expanding services around Google Search has worked very well, with projects constantly popping up, getting tested, and then growing or being discontinued (many promising products that were discontinued). This has ensured Google’s healthy organic growth over time.
(click to enlarge)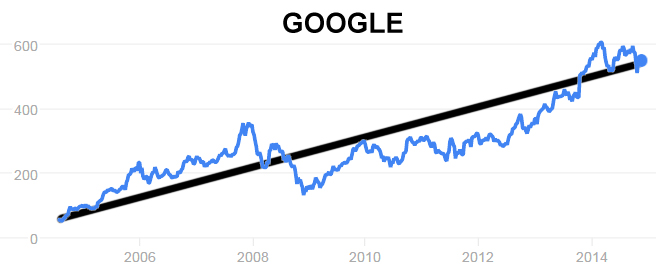
Figure 4: Google’s consistent growth since going public. Chart Source: Google
Algorithmic Analysis: Explanation
I Know First is a financial services firm that utilizes an advanced self-learning algorithm to analyze, model and predict the stock market. The algorithm produces a forecast with a signal and a predictability indicator. The signal is the number in the middle of the box. The predictability is the number at the bottom of the box. At the top, a specific asset is identified. This format is consistent across all predictions.
(click to enlarge)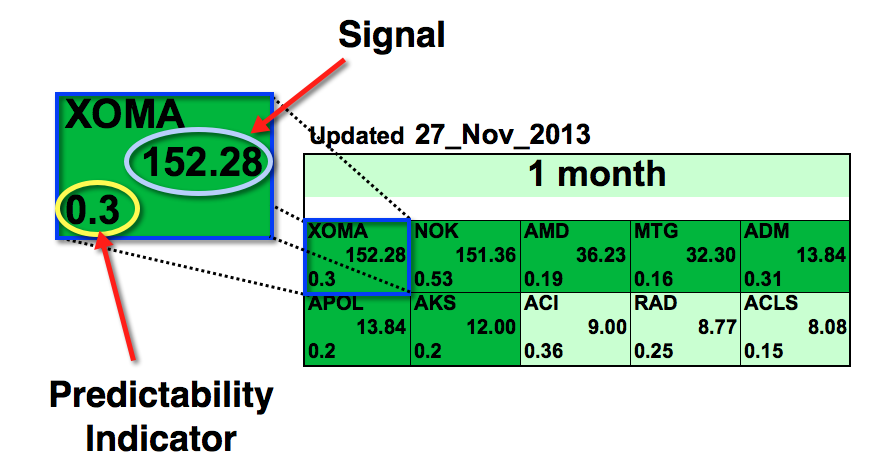
Figure 5: Example of an I Know First Algorithmic Heat Map.
In this particular Top 10 Stocks Forecast from November 27th 2013, XOMA had the strongest 1-month signal but did not have the strongest predictability. As the asset is in a deeper green color box, this indicates that the algorithm is very bullish.
Signal
This indicator represents the predicted movement direction/trend; not a percentage or specific target price. The signal strength indicates how much the current price deviates from what the system considers an equilibrium or “fair” price. The signal strength is the absolute value of the current prediction of the system. The signal can have a positive (predicted increase), or negative (predicted decline) sign. The heat map is arranged according to the signal strength with strongest up signals at the top, while down signals are at the bottom. The table colors are indicative of the signal. Green corresponds to the positive signal and red indicates a negative signal. A deeper color means a stronger signal and a lighter color equals a weaker signal.
Analogy with a spring: The signal strength is how much the spring is stretched. The higher is the tension the more it’ll move when the spring is released.
Predictability
This measures the importance of the signal. The predictability is the historical correlation between the prediction and the actual market movement for that particular asset, which is recalculated daily. Theoretically the predictability ranges from minus one to plus one. The higher this number is the more predictable the particular asset is. If you compare predictability for different time ranges, you’ll find that the longer time ranges have higher predictability. This means that longer-range signals are more important and tend to be more accurate.
Algorithmic Analysis: Forecast
The algorithmic forecast from November 13th, 2013 signaled a bullish outlook for Google. After publishing our review we can see a slowdown in the last year’s growth; however, the stock still made a respectable 8.06% return. Because the review refers to a 1 year forecast, the signal and predictability indicators tend to be much stronger, as the algorithm is more confident in the forecast the longer the term is. Below is the most recent algorithmic forecast:
(click to enlarge)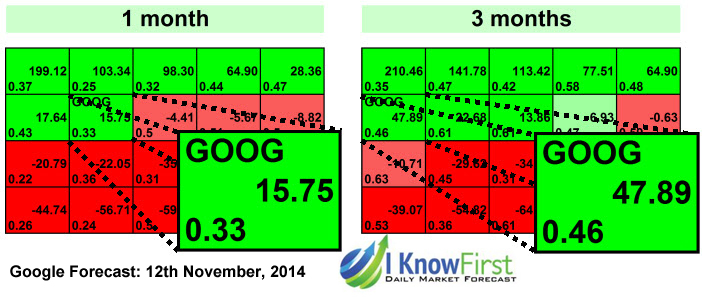
Figure 6: I Know First 1 month, 3 months and 1 year prediction heat maps for Google from November 12th, 2014.
The current algorithmic forecast (12th November, 2014) has a strong bullish signal for Google. The 1 month and 3 months’ time horizons have a signal of 15.75 and 47.89, with a very high predictability of 0.33 and 0.46 respectively. For the optimal long strategy we recommend executing your trade only when two rules hold true. The first is when the last close of the specific market is above the 5 days average. The Second when the average of the last 5 days forecast signals is “up”. If both rules are true, then it is an optimal buy.
Conclusion
Google growth has not been a roller coaster ride. It was consistent, persistent, and resistant to other paradigms affecting other growth stocks – almost imitating a dividend stock. Most companies which have these types of growths tend to have an unsolid base (new technology, pharmaceutical, high anticipated growth), and thus tend to be a more speculative investment. Google has proven to have a solid base product which is near impossible to compete with (Google Search), and a continued appetite to innovate and grow around it. These qualities have led to a growth slope from day one, and are the reason I Know First recommends the stock as a solid short and long term investment.
I Know First Research is the analytic branch of I Know First, a financial startup company that specializes in quantitatively predicting the stock market. This article was written by Daniel Hai, one of our interns. We did not receive compensation for this article, and we have no business relationship with any company whose stock is mentioned in this article.
