Why The Algorithm Is Bearish On JPMorgan
Confira nosso último artigo (21/07/2014 )no Seeking Alpha: Why The Algorithm Is Bearish On JPMorgan

Clique aqui para ler, comentar, e opinar diretamente no Seeking Alpha.
Summary
- Regulations threaten viability of global banking model.
- While the FICC business has slowed down, JPMorgan Chase is leading in market share.
- JPM shares are forecasted to fall in the short and mid term time horizons but rise in the 1-year time horizon.
At a global level, the scale of change in the banking industry since 2008 has been unprecedented. In the face of significant headwinds, banks have been trying to restructure themselves and rehabilitate the industry. JPMorgan Chase & Co. (NYSE:JPM) has been a focal point of debate on the American banking industry, with CEO Jamie Dimon stirring heated discussions about bank regulation and opportunities and challenges in global finance. The industry has suffered major reputational damage while the regulatory rulebook has been rewritten.
At the beginning of this month, President Barack Obama stated in an interview with the Marketplace radio program that further reform is needed and some of the changes could include “restructuring the banks themselves.” While praising the four-year old Dodd-Frank law requiring large banks to hold bigger capital cushions as well as the tightening of consumer protection rules, he also singled out bank trading desks as being a particular area of residual concern. JPMorgan Chase and Goldman Sachs Group Inc. (NYSE:GS) shares subsequently increased when the banks reported better-than-forecast earnings, but this was overshadowed by the Federal Reserve’s concerns about valuations among social-media and biotech companies causing the S&P 500 stumble.
There have been encouraging signs from JPMorgan Chase, such as its expanding profit margins, increase in stock price over the past year, enticing valuation levels and overall reported performance in the second quarter but is now the best time to invest? According to our time series analysis algorithm forecasts that shares will slide in the 1-month and 3-month time horizons but rebound in the 1-year time horizon. The numbers posted were not as bad as feared, as JPMorgan Chase beat analyst’s already depressed estimates of a $5.4 billion forecast by posting a $5.9 billion profit. However this figure is almost 8% weaker than the $6.5 billion profit reported in Q2 ’13. JPM can be a solid component of a well-diversified portfolio but due to industry wide headwinds, it may be a better option to put the stock in a watch list for the time being before adding shares.
A Broader Look At The Industry – Trading Units Taken-Aback
A recent research report by Credit Suisse analysts highlights that fixed-income, commodities, and currencies trading units (FICC) generated $80 billion in 2013 down 44% from a peak of $144 billion in revenue for the top 10 banks in 2009. This number is also down 15% year over year, representing the lowest revenues post crisis. Weaker G10 rates and securitization revenues deleteriously impacted revenues. Figure 1 showsreported core fixed income trading revenues based on the top 10 players including JPMorgan Chase, Citigroup (NYSE:C), Goldman Sachs, Deutsche Bank, Bank of America (NYSE:BAC) and major players.
(click to enlarge)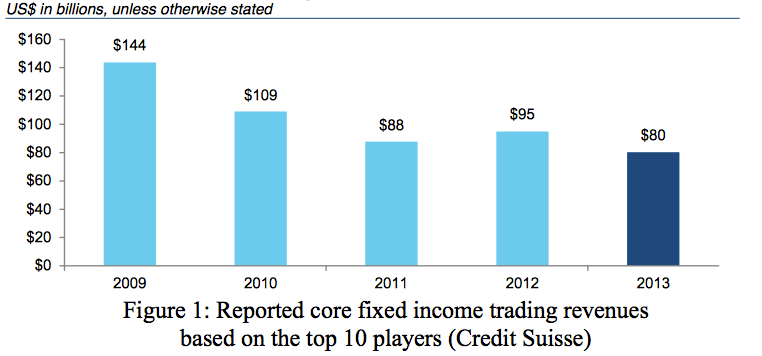
G10 Credit & Rates are the biggest FICC businesses based on Coalition Index data, however the relative contribution of G10 Rates has ominously diminished over the last few years, dwindling from a peak of 37% of total FICC revenues in 2009 to just 24% in 2013. The decline in FICC trading revenue is attributed at least somewhat to the drop in trading of government bonds, complex derivative interest rate securities, and esoteric debt like commercial and home loans.
The FICC slowdown can also be attributed to regulations such as the Volcker rule. This rule, implemented as a part of the Dodd-Frank law, keeps banks from making speculative investments that do not benefit its customers. Regardless of your actual stance on this law, this regulatory scrutiny is partially responsible for why firms like JPMorgan and others have been reducing their commodities activities. Figure 2 shows FICC – industry revenue distribution in 2013 based on Coalition Index data.
(click to enlarge)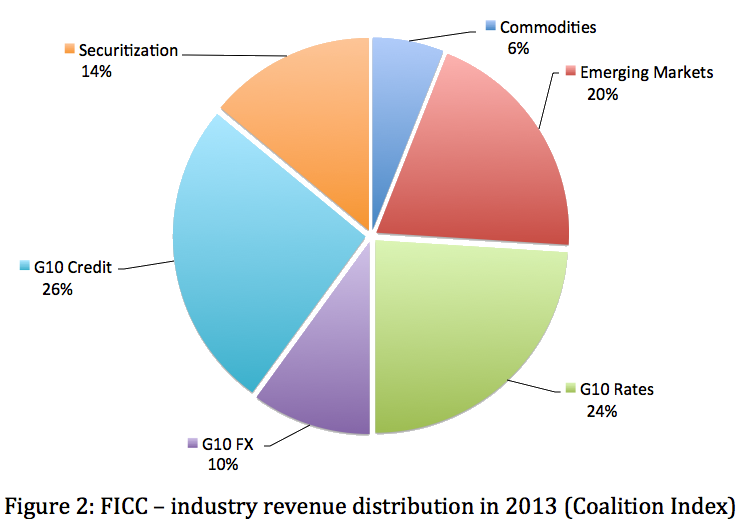
Resources allocated to FICC have been declining and FICC front office headcount of as of Q4 ’13 is down 20% from post crisis peak levels. Due to the reduction in the FICC revenue pool and increased capital requirement management teams continue to moderate resources allocated to the FICC business. Figure 3 shows the FICC front office headcount declining in the thousands from quarter Q1 ’09 until Q3 ’13. Figure 4 shows that the front office headcount only represents 36% in Q3 ’13 down from 39% in 2Q09.
(click to enlarge)
(click to enlarge)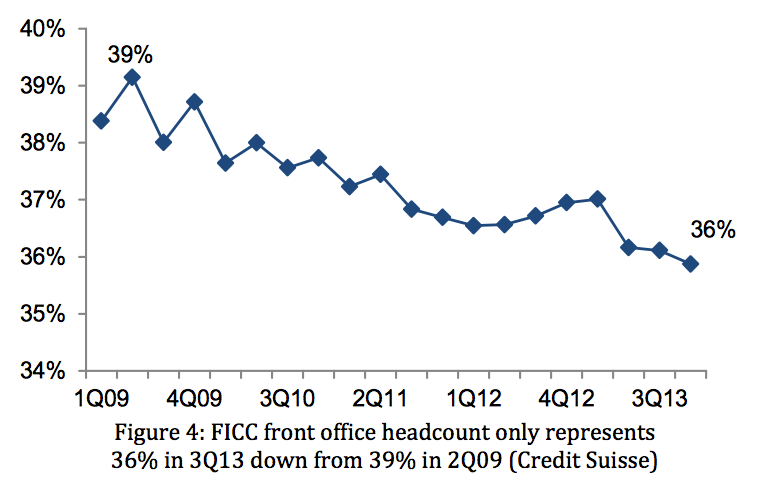
The good news for shareholders of JPMorgan is that U.S. commercial banks now dominate the FICC industry with particularly strong market shares where JPMorgan is leading with 19% market share followed by Citigroup at 16%. While the overall industry revenue pool has deteriorated these two companies have been able to gain market share over the past 3 years.
European banks have suffered a loss of market share due to the macro conditions on the continent, which have been intensified by efforts to restructure business models that can accommodate relatively lower capital ratios and an fluctuating regulatory landscape.
Q2 ’14 Performance Analysis
There are many constraints and hurdles that banks have had to adapt and overcome, including new global standards that challenge the profitability of business lines, predominantly within corporate and investment banking divisions or retail patrons that require more transparency, personalized products and seamless transitions between channels. The industry has been damaged by the cumulative impact of regulatory and compliance failures however demand from shareholders to implement business models that produce sustainable returns and reward investors are still omnipresent. For now JPMorgan Chase should be put in a watch list, as it has done a noteworthy job this past quarter, but not well enough to make it a buy just yet. Even though earnings per share slid 9% below the $1.60 last year, reported at $1.46 in the second quarter, it still surpassed analyst’s expectations of $1.29 according to Yahoo! (NASDAQ:YHOO) Finance. With reported revenue of $25.3 billion for the quarter, JPMorgan was able to give back $3 billion to shareholders in the form of a dividend payout as well as increase shareholder value by repurchasing $1.5 billion in the quarter.
Net income also fell year over year from $6.5 billion to $6 billion. One of the reasons for this decline included a weakening in mortgage banking revenue, which dropped from $1.8 billion to $1.3 billion. The Corporate and Investment Bank division also witnessed net income fall 31% year over year down to $2 billion. On the other hand, the Asset Management and Commercial Banking businesses increased net income by 10% and 6% respectively to $1.2 billion. Market revenue, which includes fixed-income trading and equities trading, fell 14% year-over-year to $4.65 billion.
JPMorgan’s return on tangible equity was reported at 14%. This is still below the 17% reported in 2Q13 but it is an improvement from the first quarter this year from 13%. Return on assets stood at 0.99%. This was a drop from 1.09% in 2Q13 but an improvement from 0.89% in the first quarter.
JPMorgan Chase Algorithmic Outlook
We utilize an advanced self-learning algorithm based on Artificial Intelligence (AI), Machine Learning (ML), and incorporates elements of Artificial Neural Networks and Genetic Algorithms in order to model and predict the flow of money in almost 2,000 markets from 3 days to a year. As such, we promote algorithmic trading coupled with a vigilant risk management strategy and fundamental analysis for avant-garde investment strategies designed to mitigate maximum amount of risk as well as to optimize potential returns. Just to be clear, this is not high frequency trading and the differences are explained here.
The market prediction system is entirely empirical and not based on human-derived assumptions. This system can also be referred to as a “Big Data” solution for Wall Street by incorporating popular types of convergence averages and moving averages that have been traditionally used to forecast assets with complex and intelligent algorithms that can make these predictions more accurate and efficient.
The human factor is limited to building the mathematical framework and initially presenting the system with the “starting set” of inputs and outputs, which is also utilized for recognizing every other market opportunity. The algorithm then repetitively proposes “theories” and recurrently tests them automatically on years of daily market data. It then validates them on the most recent data, which prevents over-fitting. By separating the predictable part from stochastic (random) noise, the algorithm is able to create a model that projects the future trajectory of the given market in the multi-dimensional space of other markets. The output of the predicted trend is a number, known as the signal, which is used by traders to identify entry and exit points in the market. While the algorithm can be used for intra-day trading, the predictability tends to become stronger over longer time horizons, such as the 1-month, 3-month and 1-year forecast, making this market prediction system ideal for longer-term trading.
The color-coded forecast is very easy to read, where green indicates a bullish signal and red indicates a bearish signal. Deeper greens signify that the algorithm is very bullish, and vice-versa for deeper reds. The signal is the number flush right in the middle of the box and the predicted direction (not a specific number or target price) for that asset, while the predictability is the historical correlation between the prediction and the actual market movements. In other words, the signal represents the forecasted strength of the prediction, while the predictability represents the level of confidence. These are two independent indicators, but consider both as you make your own analysis. Figure 5 shows an algorithmic prediction for JPM from 3 months ago. Algorithmic traders utilizing our Best Bank Stocks Forecastreceived this forecast.
(click to enlarge)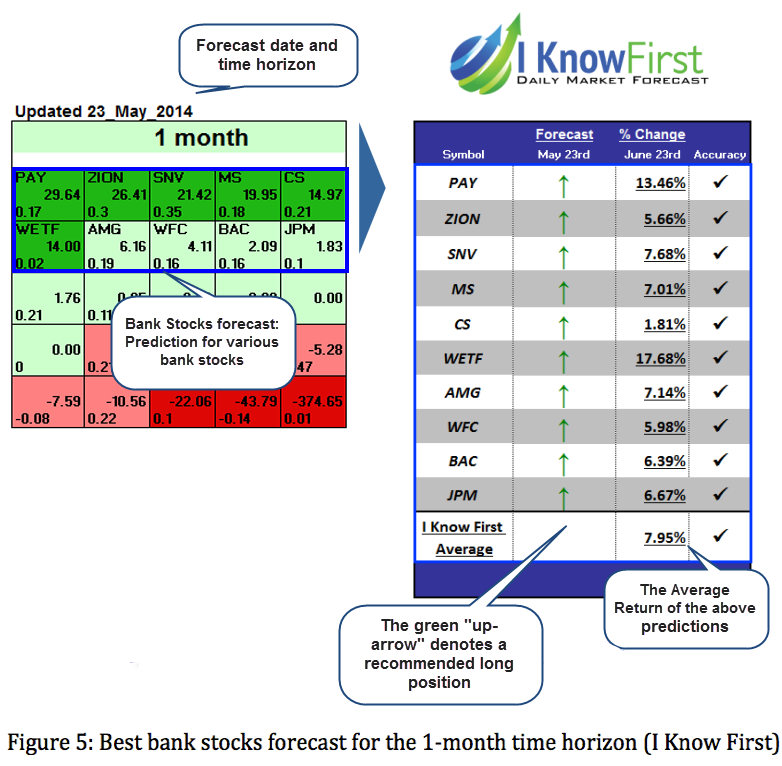
In accordance with the algorithmic forecast, JPM rose 6.67% over the stated time horizon. LMT had a signal of 1.83 and predictability of 0.1 in this 1-month forecast. Comparing the algorithmic performance from the forecast above to the most contemporary forecast is an excellent strategy for rationalizing your expectations utilizing algorithmic trading as one instrument in your analysis process. Figure 3 shows the current algorithmic prediction for JPM in the 1-month, 3-month and 1-year time horizons.
(click to enlarge)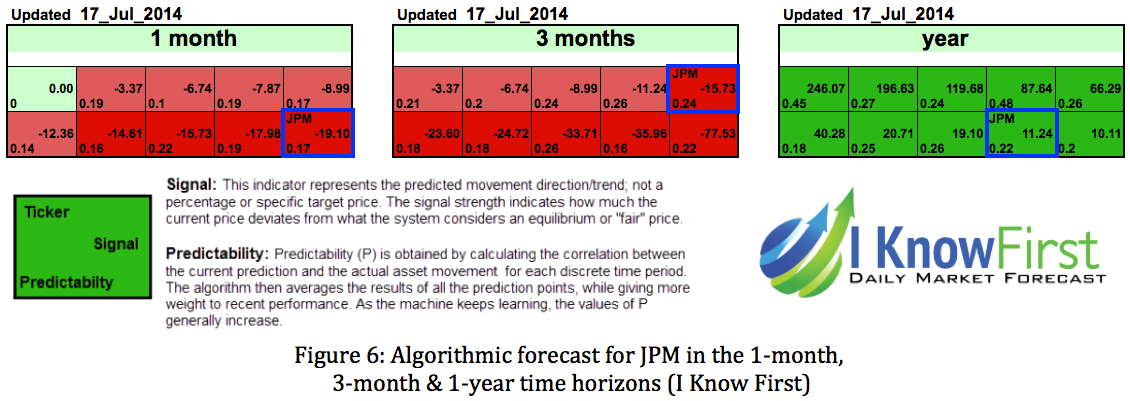
JPM has a bearish signal for the 1-month and 3-month time horizons but a bullish signal for the 1-year time horizon. This insinuates that shares will drop over in the short to midterm time horizons before rebounding over the longer time horizon. The deeper colors, both red and green, indicate that the algorithm anticipates a large magnitude of movement for JPM shares. Algorithmic traders utilize these daily forecasts as a tool to enhance portfolio performance, verify their own analysis and act on market opportunities faster. We never recommend blindly purchasing assets that are endorsed by the algorithm without your own additional analysis.
Conclusion
While JPMorgan beat earnings expectations, it would not be recommended to buy JPM shares immediately. While this stock has been able to weather the industry-wide headwinds, they (headwinds) are still too strong to be bullish on JPMorgan, at least just yet. In accordance with the algorithmic forecast, I would recommend putting JPM in watch list and wait for a better buying opportunity as shares are expected to slide before rising again. It will take some time for JPMorgan and others to acclimate, as they incorporate enough flexibility into their models to respond to reforms that emerge. Due to industry wide hurdles and a bearish short to mid-term algorithmic forecast, it may be better a better choice to watch JPM for the time being before adding shares.
Business disclosure: I Know First Research is the analytic branch of I Know First, a financial services company that specializes in quantitatively predicting the stock market. Joshua Martin, an I Know First Research analyst, wrote this article. We did not receive compensation for this article (other than from Seeking Alpha), and we have no business relationship with any company whose stock is mentioned in this article.